Know your real margins — not your guesses
You quoted $4,500 for the staging. But after paying your installers, buying fresh throw pillows, and replacing that lamp your client's kid broke — did you actually make money? ThriveOS answers that question, per project, in real time.

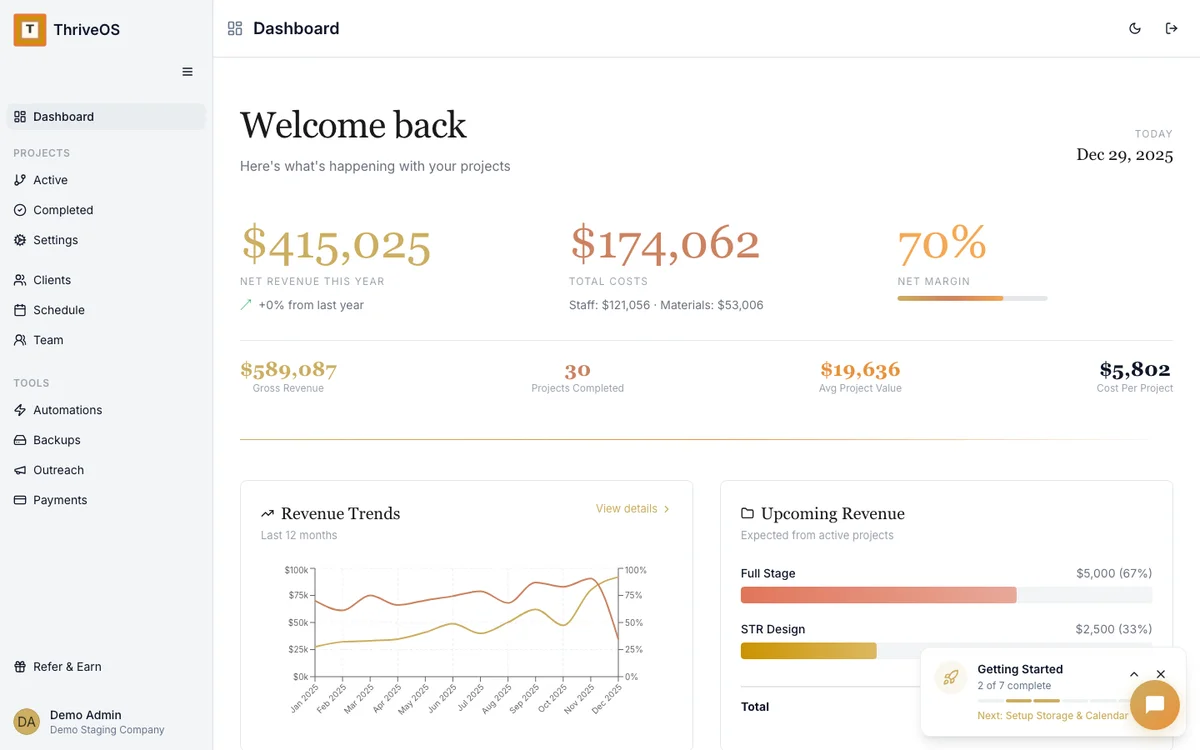
Stop guessing. Start knowing.
Revenue minus costs equals profit. Simple math, but most staging businesses can't run it per project. ThriveOS makes it automatic.
Track labor costs per project, per team member
Your installers spent six hours on the Elm Street staging and four on Oak Avenue. ThriveOS records that — not as a time sheet in a separate app, but right inside the project. Labor costs flow into your project financials automatically.
When you're quoting the next job, you won't be guessing how long it takes. You'll know, because you tracked it on the last ten.
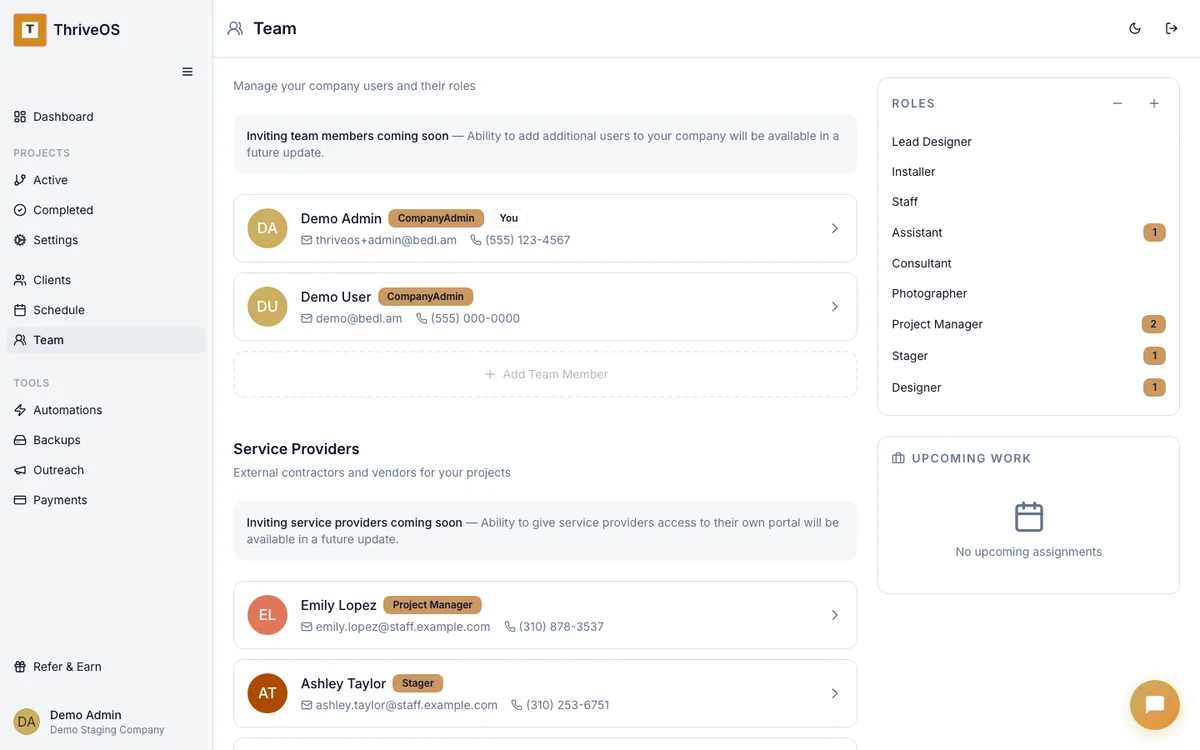
Materials and expenses, attached to the job that used them
That $200 trip to HomeGoods for accent pieces? Log it to the project. The rental delivery fee? Same. When you look at the Elm Street staging, you see everything: what you charged, what it cost you, and what you kept.
No more end-of-quarter archaeology trying to figure out which expenses went with which job.
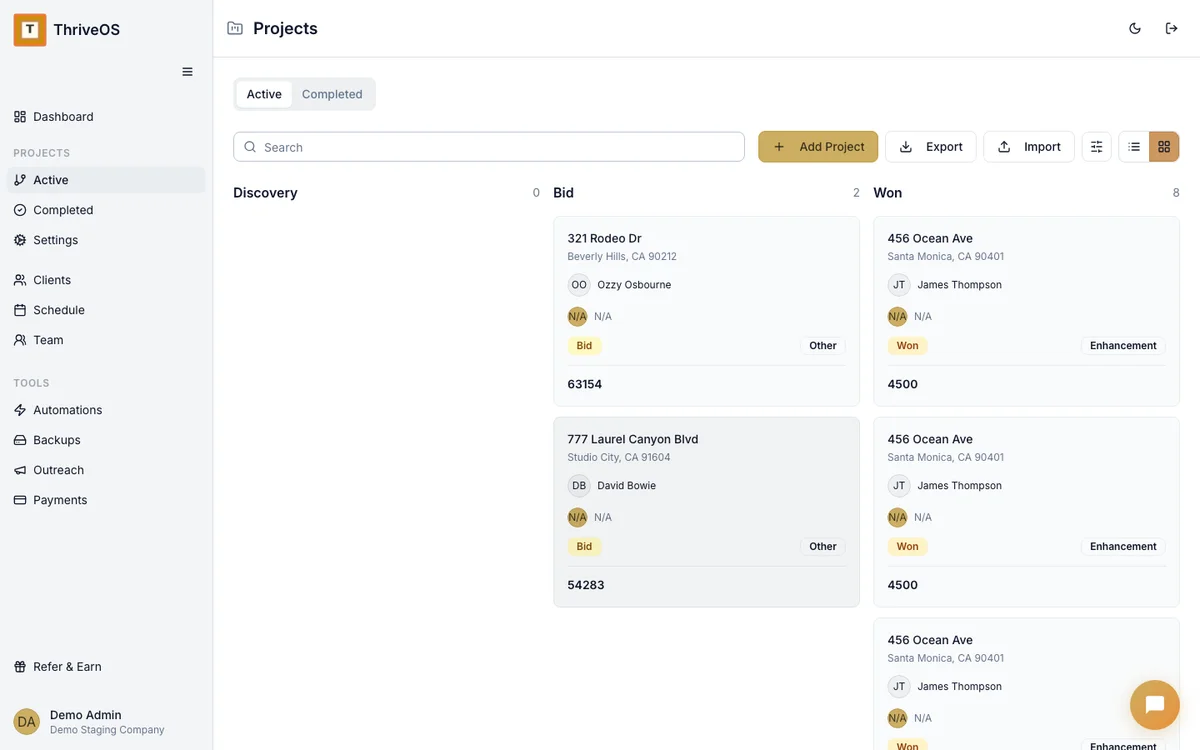
See your margins on the dashboard, not in a spreadsheet
Your ThriveOS dashboard shows net revenue, total costs, and overall margin right at the top. Not buried in a report you have to run. Not in a spreadsheet you update manually every Friday.
Open your laptop, glance at the numbers, know where you stand. That's it.


Busy and profitable are two different things
You can run 30 stagings a quarter and still be barely breaking even if your pricing doesn't account for real costs. Most stagers price based on feel — what the market will bear, what competitors charge, what seems fair.
ThriveOS gives you the data to price based on facts. Your labor rates, your material costs, your actual margins. It's the difference between running a hobby and running a business.
While tools like HoneyBook and Dubsado track who paid you, ThriveOS tracks what each project actually cost — labor hours, materials, vendor fees — so you know your real margin on every staging, not just your gross revenue.
A real example: two projects, same revenue, very different margins
| Elm Street Staging | Garcia Residence | |
|---|---|---|
| Revenue | $4,500 | $4,500 |
| Labor (install + destage) | $640 | $1,200 |
| Materials & supplies | $180 | $520 |
| Delivery / transport | $120 | $380 |
| Total costs | $940 | $2,100 |
| Profit | $3,560 (79%) | $2,400 (53%) |
Same price. Very different outcomes. Without per-project cost tracking, you'd never know the difference.
Price smarter. Earn more. Work the same.
When you know your margins per project, you know which types of jobs are worth pursuing — and which ones to price differently next time.
Try It Free